Persistence graphical tools user manual
Definition
|
These graphical tools comes on top of persistence results and allows the user to display easily persistence barcode, diagram or density. Note that these functions return the matplotlib axis, allowing for further modifications (title, aspect, etc.) |
|
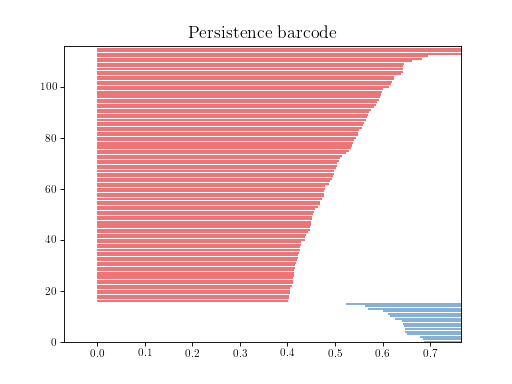
Show persistence as a barcode
This function can display the persistence result as a barcode:
import matplotlib.pyplot as plt
import gudhi

off_file = gudhi.__root_source_dir__ + '/data/points/tore3D_300.off'
point_cloud = gudhi.read_points_from_off_file(off_file=off_file)

rips_complex = gudhi.RipsComplex(points=point_cloud, max_edge_length=0.7)
simplex_tree = rips_complex.create_simplex_tree(max_dimension=3)
diag = simplex_tree.persistence(min_persistence=0.4)

gudhi.plot_persistence_barcode(diag)
plt.show()
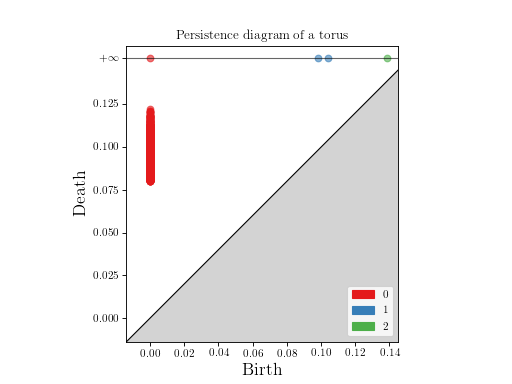
Show persistence as a diagram
This function can display the persistence result as a diagram:
import matplotlib.pyplot as plt
import gudhi

# rips_on_tore3D_1307.pers obtained from write_persistence_diagram method
persistence_file=gudhi.__root_source_dir__ + \
    '/data/persistence_diagram/rips_on_tore3D_1307.pers'
ax = gudhi.plot_persistence_diagram(persistence_file=persistence_file,
    legend=True)
# We can modify the title, aspect, etc.
ax.set_title("Persistence diagram of a torus")
ax.set_aspect("equal")  # forces to be square shaped
plt.show()
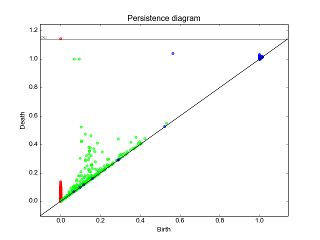
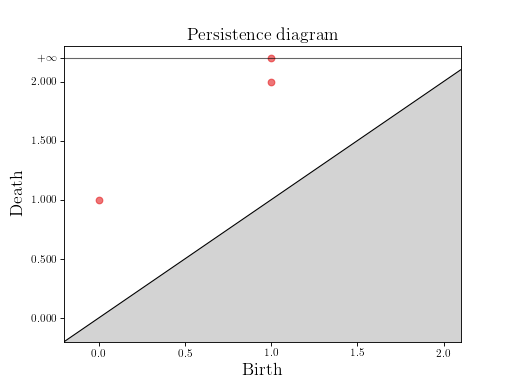
Note that (as barcode and density) it can also take a simple np.array of shape (N x 2) encoding a persistence diagram (in a given dimension).
import matplotlib.pyplot as plt
import gudhi
import numpy as np
d = np.array([[0, 1], [1, 2], [1, np.inf]])
gudhi.plot_persistence_diagram(d)
plt.show()
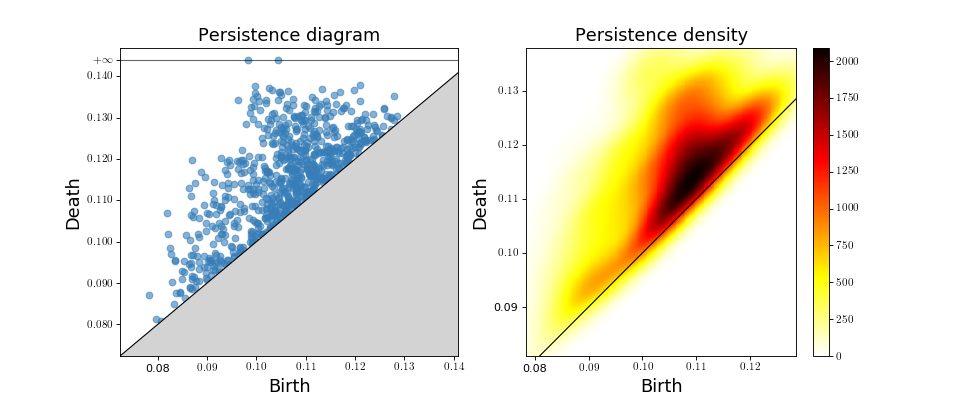
Persistence density
- Requires
If you want more information on a specific dimension, for instance:
import matplotlib.pyplot as plt
import gudhi
# rips_on_tore3D_1307.pers obtained from write_persistence_diagram method
persistence_file=gudhi.__root_source_dir__ + \
    '/data/persistence_diagram/rips_on_tore3D_1307.pers'
birth_death = gudhi.read_persistence_intervals_in_dimension(
    persistence_file=persistence_file,
    only_this_dim=1)
pers_diag = [(1, elt) for elt in birth_death]
# Use subplots to display diagram and density side by side
fig, axes = plt.subplots(nrows=1, ncols=2, figsize=(12, 5))
gudhi.plot_persistence_diagram(persistence=pers_diag,
    axes=axes[0])
gudhi.plot_persistence_density(persistence=pers_diag,
    dimension=1, legend=True, axes=axes[1])
plt.show()